What should a distributor or retailer look for when deciding which senior-pet supplements will still sell next year? A recent quarterly report appears to offer an obvious answer: dental care grew strongly while nutraceuticals declined. But the more useful lesson is not which category won. It is why one company’s product lines moved in different directions at the same time — and what buyers can use when category averages stop being enough.
What one company’s second quarter actually showed
A listed European companion-animal health group’s second-quarter 2026 results showed the business moving in several directions at once. Group revenue reached SEK 670 million, up 4% as reported and 7% organically. Operating EBITDA was SEK 129.4 million, while gross margin reached 61%.
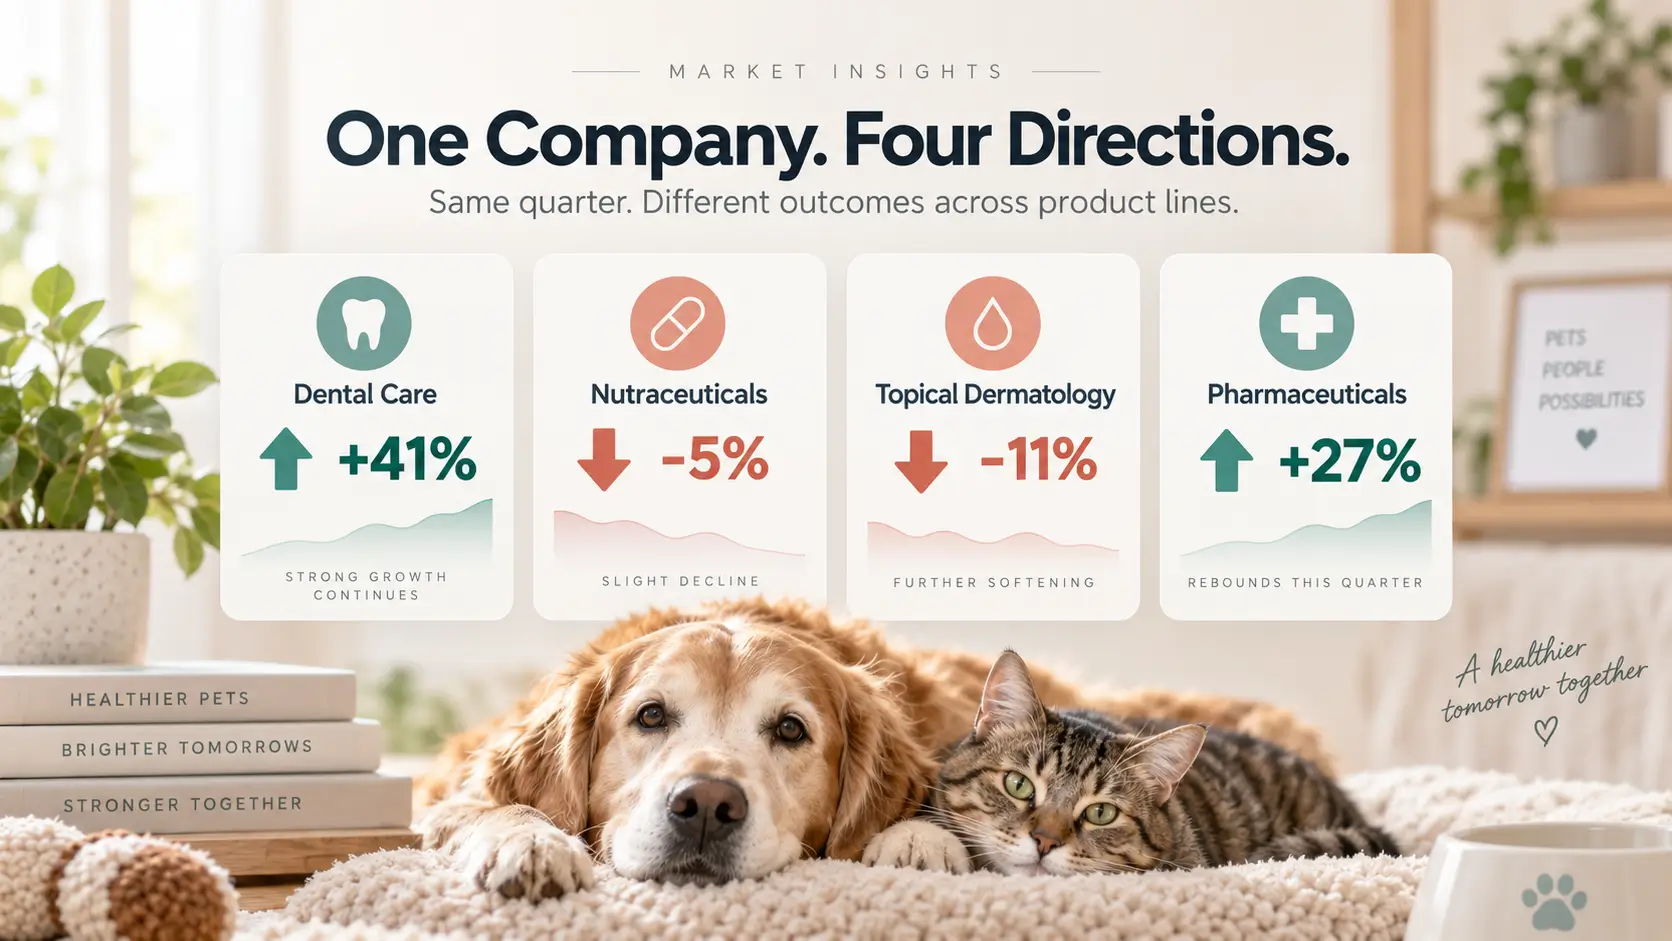
Those group-level figures provide financial context, but they do not answer a buyer’s assortment question. The breakdown by business line is more revealing:
| Business line or region | Reported result | What it shows |
|---|---|---|
| Dental care | +41% reported growth; +44% organic growth; SEK 157 million | One business line expanded sharply |
| Nutraceuticals | -5%; SEK 276 million | The largest segment by revenue contracted |
| Topical dermatology | -11% | Another health-related line moved in the opposite direction |
| Pharmaceuticals | +27% | A fourth line grew under the same corporate structure |
| North America | -3% organically | The group’s largest market faced pressure |
| Europe | +19% organically | Regional performance was not uniform |
Source: the group’s Q2 2026 (April–June) half-year report. Reported and organic figures are stated as disclosed.
The first conclusion should be a cautious one. These figures come from one company and one quarter. They are not a market-wide forecast, and they do not prove that dental care will outperform every other pet-health category next year.
They establish something narrower but more useful: a single pet-health company can carry growing and shrinking lines at the same time. That alone should make buyers cautious about using a category average as a standalone planning signal.
Why category averages fail buyers
A category label can hide too much variation. The nutraceuticals figure is reported as one combined segment. It tells us that the segment contracted by 5%, but it does not tell us how that change was distributed across joint support, skin health, digestion, calming or other benefits.
It also does not tell us whether a specific SKU gained or lost traction, whether the change came from pricing, distribution, regional mix, customer retention, product launches or channel inventory.
That distinction matters for any buyer planning next year’s range. “Nutraceuticals declined” is not the same as “every nutraceutical SKU is weakening.” Likewise, “dental care grew” is not enough to explain why a particular product will earn repeat purchases in a different market or channel.
What the quarterly data does not prove
- It does not establish a market-wide trend.
- It does not explain which nutraceutical benefits declined.
- It does not prove why one segment grew.
- It does not forecast next year’s sales for an individual SKU.
- It does not replace product-level evidence from the supplier.
What separated the growing line — and what the data cannot prove
When one business line grows while another contracts, buyers can consider several possible explanations.
The first is benefit-specific demand. Consumers may be responding differently to dental care, joint support, skin health or other needs. The second is regional or channel mix: a product may have stronger exposure to a growing market, a better-performing retailer or a more favourable distribution model. The third is the quality of the product’s feedback loop — how quickly and clearly the customer can connect use with an observable signal, make sense of that signal and decide whether to continue.
The first two explanations require company-specific evidence. They cannot be transferred automatically from one supplier to another. The third is more portable. It gives buyers a way to evaluate a product even when another company’s financial report cannot answer the question.
Two independent signals point the same way. US search interest for dog dental powder rose 50% year on year through September 2026, reaching roughly 8,100 searches a month — a small absolute number, and search interest is not sales data, so it is a directional signal and should be treated as one. Capital reads it similarly: a US company that raised USD 8.3 million in September 2026 has one product commercially available, and it is a dental film. When a new entrant with limited capital chooses which single SKU to take to market first, that choice is a read on where it thinks demand is least contested.
The signal buyers can use instead
A product’s feedback loop is the time and clarity between five stages:
Use → Observable signal → Interpretation → Adjustment → Repeat purchase
A shorter and clearer loop does not automatically make a product better. It does, however, make it easier for the customer — and for the channel — to understand what is happening after the first purchase.
Where that interval is short, the product carries its own reorder: the customer decides, and no one has to re-convince them. Where it is long, reorder depends on external persuasion — brand trust, a retailer’s recommendation, a veterinary suggestion. Those are real, but they are also borrowed. They weaken when a trusted counter assistant leaves, when a cheaper competitor lands on the same shelf, or when the veterinary conversation simply does not happen that quarter.
This is a framework rather than an industry standard, and it is not a precise measure — we do not present it as one. Its value is narrower and more practical: it can be answered before a purchase order is signed, about one SKU, in any market. That is the property a signal needs once the aggregate has stopped being reliable.

Why senior-pet nutrition has a harder feedback loop
Senior-pet nutrition often has a longer and noisier feedback loop than products with an immediately visible use occasion.
The customer may not know what change to expect, how long to wait or which indicators matter. Results may also be influenced by age, activity, existing diet, feeding consistency and individual variation. Even when the product is used correctly, the customer may lack a baseline for comparison.
That creates a commercial problem. A product may be used consistently, but the customer may still struggle to interpret the experience. Without a clear feedback loop, the next purchase can become a matter of habit, hope or promotional timing rather than informed continuation.
This does not mean that a longer feedback loop makes a product unsuitable for the shelf. It means the product may need more support around it: better education, clearer expectations, more consistent observation and a way to understand individual trends over time.
How to evaluate a senior-pet supplement SKU
Before adding a senior-pet supplement to the range, buyers should ask four questions:
- What is the observable customer signal? Can the customer understand what to monitor without relying only on broad benefit language?
- How long is the expected feedback cycle? Does the supplier explain what can reasonably be observed in the short, medium and longer term?
- How is individual variation handled? Does the product experience account for the fact that senior pets do not share one universal baseline?
- What happens between purchase and repurchase? Does the supplier provide a support system that helps the customer continue, review and understand the routine?
The strongest opportunity is not necessarily the product with the loudest claim. It may be the product that sits inside the clearest repeatable routine — one in which the customer knows what to observe, how to interpret change and when to reassess.
What this means for the senior-pet aisle
This is where connected senior-pet health becomes commercially relevant.
A smart collar cannot prove that a supplement caused a specific outcome. It does not shorten the biological response time, and it should not be positioned as a diagnostic device. What it can do is reduce the information gap around the pet’s daily routine by creating a more consistent at-home record of individual trends.
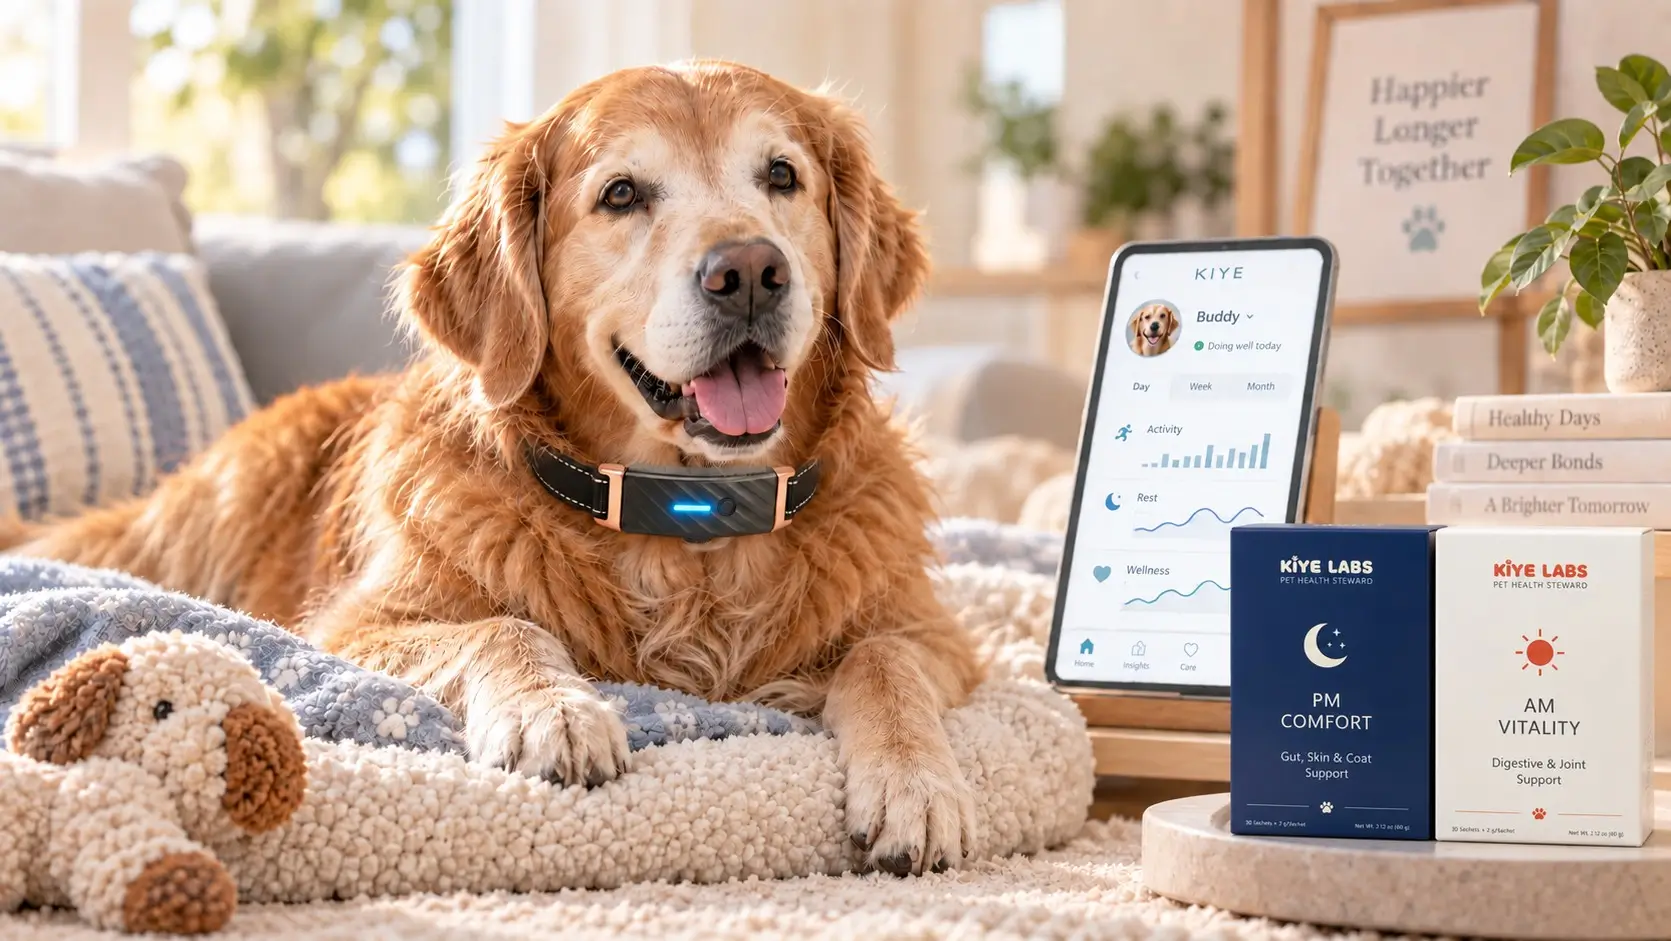
KIYE connects three layers:
Monitor
The KIYE Smart Health Collar supports long-term observation of activity, rest and related wellness trends.
Understand
The AI Health Platform helps organize changes against the individual pet’s baseline rather than relying only on generic category claims.
Support
AM Vitality and PM Comfort create a day-and-night nutrition routine for senior dogs.
The commercial value is not a promise that data will prove efficacy. It is the creation of a more observable support routine around the product. That can give owners a clearer basis for follow-up and give channel partners a stronger way to explain why the product belongs in a connected senior-pet health assortment. Collar data supports wellness awareness and helps surface changes worth raising with a veterinarian; it does not diagnose or treat anything, and it is not a substitute for clinical assessment.
From quarterly data to a buying signal
The reasoning is therefore straightforward. Dental care’s 41% growth should not be treated as a direct recommendation for every buyer, because the same company’s business lines moved in different directions and the nutraceutical figure is too aggregated to explain individual benefits or SKUs. Buyers need a criterion that does not depend entirely on another supplier’s financial reporting. Feedback-loop length provides that criterion because it focuses on what happens after the product reaches the home — and senior-pet nutrition, which often has a longer and less observable loop, is where that criterion bites hardest.
The point is not to predict the market from one quarter. It is to improve the quality of the SKU question:
How easily can this product create a clear, repeatable and understandable customer feedback cycle?
For buyers rebuilding a supplement plan this cycle, the sequencing is straightforward: stop budgeting at category level, ask every supplier how long their loop is, and treat the answer as a term of the deal rather than a marketing footnote. You can review how we structure the pairing — samples, positioning support and FBA-ready packaging — on the KIYE partner model page.
Sources
- Listed European companion-animal health group — Q2 2026 (April–June) half-year report: net revenue SEK 670m (+4% reported, +7% organic); operating EBITDA SEK 129.4m; gross margin 61%. Segments: Dental SEK 157m, +41% (+44% organic); Nutraceuticals SEK 276m, −5%; Topicals/Dermatology −11%; Pharmaceuticals +27%. North America −3% organic; Europe +19% organic. Reported as one company’s one quarter; segments are not split by benefit.
- risingtrends — Top 25 Pet Trends, September 2026: US search interest for dog dental powder +50% year on year, about 8,100 searches a month. Search-interest data, not sales data.
- US Securities and Exchange Commission Form D, September 2026: a US company raised USD 8.3m; its only commercially available product is an oral dental film.
This framework is a commercial screening tool, not a clinical efficacy assessment or a market forecast. Longitudinal monitoring supports trend observation and does not diagnose medical conditions or replace veterinary evaluation.
Ask how long the loop is
If your supplement range is still budgeted at category level, the most useful question to put to a supplier is not which category is growing. It is how long it takes the customer to see anything. Request specifications and samples, or write to info@kiyepet.com to discuss channel fit.